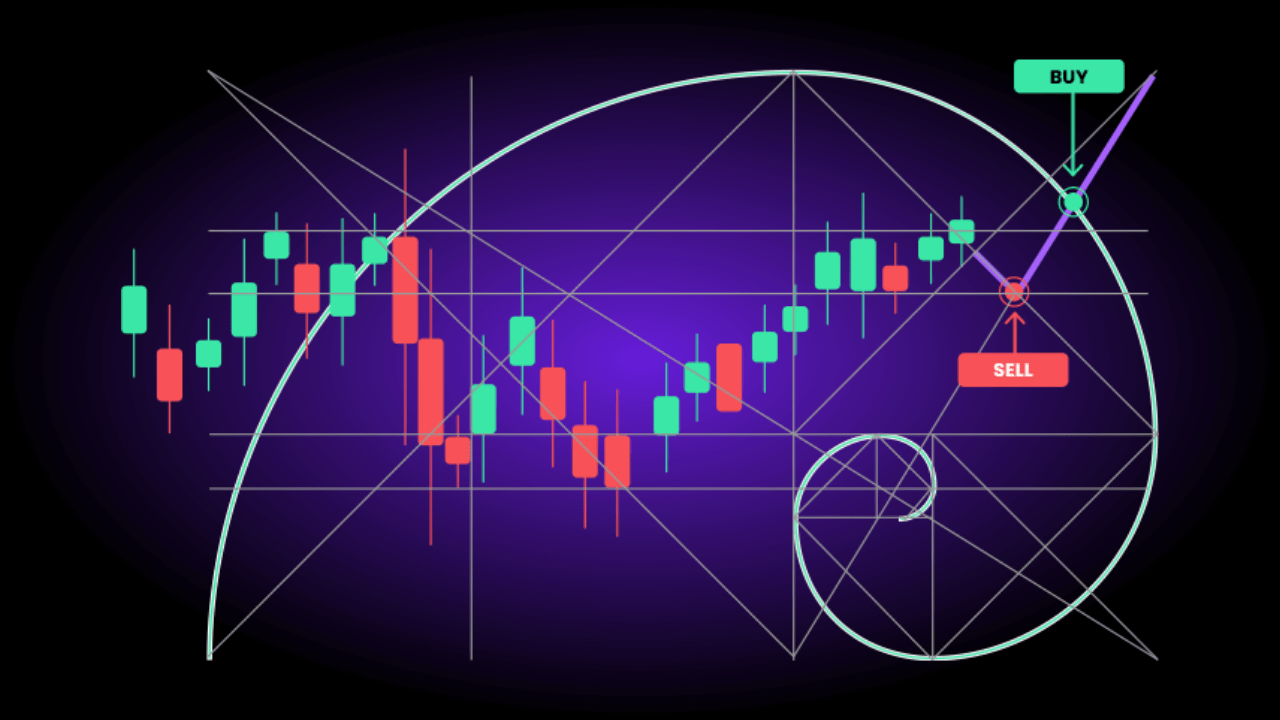
How to Use Fibonacci in Crypto Trading to Find Entry and Exit Points


KEY TAKEAWAYS
- Fibonacci retracement assists crypto traders identify potential support and resistance levels during market pullbacks.
- Derived from the Fibonacci sequence, key retracement ratios include 23.6%, 38.2%, 50%, 61.8%, and 78.6%.
- Traders use these levels to plan entry and exit points, improving timing and reducing risk.
- Charting platforms like TradingView and Binance provide built-in Fibonacci tools for simple setup.
- Combining Fibonacci with trendlines, moving averages, RSI, and candlestick patterns strengthens trade confirmation.
- Fibonacci levels are most effective in trending markets—less reliable in sideways or volatile conditions.
Trading can be highly volatile and unpredictable, but traders have several technical tools to improve their chances of success. One of the most popular and effective tools is the Fibonacci retracement.
Originally developed from a mathematical sequence, Fibonacci retracement levels assist traders spot potential areas of support and resistance in price charts. These levels are crucial for deciding where to enter and exit trades during trending markets.
Understanding The Fibonacci Sequence and Its Trading Application
The Fibonacci sequence is a series of numbers where each number is the sum of the two preceding ones, typically begining with 0 and 1. From this mathematical pattern, ratios were derived that have relevance in nature, art, and financial markets. The primary Fibonacci retracement levels used in trading are 23.6%, 38.2%, 50%, 61.8%, and 78.6%.
These percentages indicate the potential retracement of the prior move price before continuing in the original direction. In trading, these levels are drawn on a price chart by identifying the swing high and swing low points of a price move. The retracement lines then form horizontal levels that indicate where price may find support or resistance.
For example, if rises from $10,000 to $12,000, a pullback to the 38.2% Fibonacci level would mean a retracement down to about $11,236. Traders watch such levels for possible price reactions that assist predict trend continuation or reversal.
Setting Up Fibonacci Retracement on Crypto Charts
To use Fibonacci retracement effectively in crypto trading, follow these steps:
- Identify the Trend: Determine whether the market is in an uptrend or a downtrend by analyzing price action, particularly higher highs and lows for an uptrend, or lower highs and lows for a downtrend.
- Select Swing Points: For an uptrend, mark the most recent low (swing low) and high (swing high). For a downtrend, mark the high first (swing high) and then the low (swing low).
- Draw the Fibonacci Levels: Using your charting software, apply the Fibonacci retracement tool by clicking from the swing low to swing high in an uptrend (or swing high to swing low in a downtrend). This will plot the key Fibonacci levels on the price chart.
- Observe Price Behavior: Watch how the price interacts with each Fibonacci level—these are potential zones of support (in an uptrend) or resistance (in a downtrend).
Many trading platforms, such as TradingView, Binance, or excellentCrypto, have built-in Fibonacci retracement tools to simplify this process.
Finding Entry Points with Fibonacci Levels
Entry points are critical for achieving favorable risk-reward ratios. Fibonacci levels assist traders identify low-risk entry positions when prices pull back during a trend.
- In an uptrend, traders often wait for a price retracement to a Fibonacci support level such as 38.2%, 50%, or 61.8%. These levels are considered natural pullback zones where purchaviewrs might re-enter the market.
- Confirmation is key. Traders look for additional signals before entering, such as bullish candlestick patterns (hammer, engulfing), an RSI bounce from oversold conditions, or volume spikes indicating purchaseing interest near the Fibonacci level.
- Stops are typically placed just below the next Fibonacci retracement level to limit downside risk if the support does not hold.
Example: If rallies from $2,000 to $3,000, a retracement to the 38.2% level around $2,618 could serve as an entry point if price shows bullish reversal signals there.
This approach favors entering trades when prices temporarily pull back from extended moves rather than chasing breakout highs, leading to better entry pricing and lower risk exposure.
Using Fibonacci for Exit Points
Fibonacci levels also guide profitable exit strategies:
- During trends, prices may encounter resistance at higher Fibonacci retracement levels, presenting opportunities to take profits gradually.
- Traders can use Fibonacci extensions (levels like 161.8%, 200%) to project potential price targets beyond the swing high or low.
- Setting take-profit orders near these levels assists lock gains before potential reversals.
- In a downtrend, Fibonacci retracement levels above the current price provide resistance zones where shorts can be trimmed or exited.
Employing Fibonacci retracements for exits requires monitoring price reaction closely. Premature exit misses potential gains, while waiting too long exposes traders to reversals.
Combining Fibonacci with Other Technical Tools
Fibonacci retracement works best when combined with other indicators or charting techniques to confirm signals:
- Trendlines: Aligning Fibonacci levels with trendlines strengthens support or resistance areas.
- Moving Averages: Common averages like the 50-day or 200-day moving average may coincide with Fibonacci levels.
- Oscillators: RSI or can confirm momentum shifts near Fibonacci zones.
- Candlestick Patterns: Reversals or continuation patterns near Fibonacci levels add confidence.
This layered analysis approach reduces false signals and enhances trading decision quality.
Practical Example of Fibonacci Trading in Crypto
Consider a BTC chart later than a recent price surge from $30,000 to $40,000:
- Apply Fibonacci retracement from $30,000 (swing low) to $40,000 (swing high).
- The key retracement levels are approximately $37,620 (23.6%), $36,180 (38.2%), $35,000 (50%), and $33,820 (61.8%).
- If BTC pulls back to the 38.2% level around $36,180 and forms a bullish reversal candle with rising RSI momentum, a purchase entry can be placed there with a stop loss below the 50% level at $35,000.
- Target taking profits near the previous high or Fibonacci extensions beyond $40,000.
Such structured use of Fibonacci retracement assists traders purchase on dips, clear stops at logical levels, and plan exits systematically.
Risks and Limitations
While Fibonacci retracements provide valuable insights, they are not foolproof:
- False breakouts or breakdowns below/above Fibonacci levels can occur in highly volatile crypto markets.
- Over-reliance on a single indicator without confirmation from other increases risks.
- Fibonacci levels are more effective in trending markets rather than in choppy, sideways environments.
Hence, prudent risk management with stop loss orders and position sizing is essential when trading with Fibonacci tools.
Mastering Market Pullbacks: How Fibonacci Retracements Sharpen Crypto Trading Strategies
Fibonacci retracement is a versatile and widely used tool in crypto trading to find strategic entry and exit points. By marking retracement levels on price charts and coupling them with other technical signals, traders can identify high-probability zones to purchase dips or take profits.
This method assists improve timing, manage risk, and increase the overall efficiency of crypto trades. With practice, traders can incorporate Fibonacci retracement as a core part of their technical analysis toolkit for better trading outcomes.
FAQ
What is a Fibonacci retracement in crypto trading?
A Fibonacci retracement is a technical tool that identifies potential price pullback zones within a trend, assisting traders spot where support or resistance may occur.
How are Fibonacci levels calculated?
They’re based on ratios derived from the Fibonacci sequence. Common retracement levels are 23.6%, 38.2%, 50%, 61.8%, and 78.6%, representing possible price reversal points.
How do I draw Fibonacci retracements on crypto charts?
Select the swing high and swing low of a price move, then apply the Fibonacci retracement tool on your charting platform (e.g., TradingView). It will automatically display the key levels.
Which Fibonacci level is the most reliable?
The 61.8% retracement level (the “golden ratio”) is often considered the most significant, but reliability increases when multiple indicators confirm a signal.
Can Fibonacci retracements predict exact price reversals?
No. They highlight probable zones, not guarantees. Price may react around these levels, but traders should confirm entries with indicators like RSI or candlestick patterns.
Are Fibonacci retracements effective in all market conditions?
They work best in clear uptrends or downtrends. In choppy or sideways markets, Fibonacci levels may produce false signals.
How can I combine Fibonacci with other indicators?
Use Fibonacci levels alongside trendlines, moving averages, RSI, MACD, or candlestick formations to confirm trade entries and exits.


